传统的机器学习方法,现在用得不多了(自我感觉).但是有必要稍微了解一下原理。
集成学习方法可以分为Bagging,Boosting以及Stacking.
Bagging也称为bootstrap聚合,是预测模型的多个版本的聚合。每个模型都是单独训练的,并使用平均过程进行组合。装袋的主要重点是实现比任何模型单独具有的方差更小的方差。
Bootstrapping 是从给定的数据集中生成自举样本的过程。样本是通过随机抽取数据点并进行替换而形成的。
重新采样的数据包含原始数据中作为一个整体的不同特征。它绘制了数据点中存在的分布,并且往往保持彼此不同,即数据分布必须保持完整,同时保持Bootstrapping 样本之间的不相似性.其实这跟目前深度学习中的样本增强等概念又何尝不同呢.
在Bagging中,首先创建自举样本.然后,对每个样本应用回归算法或分类算法.最后在回归的情况下,对个体学习者预测的所有输出取平均值.对于分类,要么接受投票最多的类别(硬投票),要么将所有类别概率的最高平均值作为输出(软投票)
1 | import pandas |
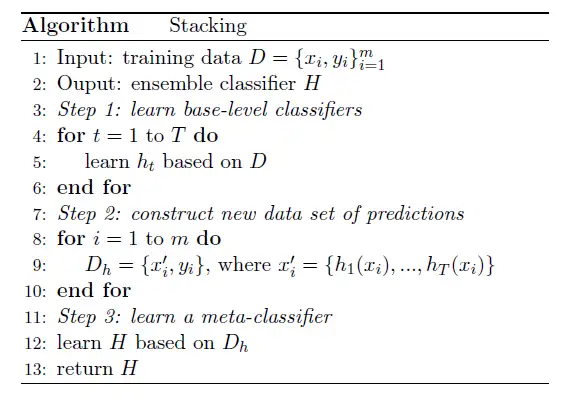
Stacking是通过一个元分类器或者元回归器来整合多个分类模型或回归模型的集成学习技术。基础模型利用整个训练集做训练,元模型将基础模型的特征作为特征进行训练.感觉有点类似于元学习(meta learning)的概念.
或者又可以分为顺序的和并行的训练器.不同的模型按顺序生成,之前模型的错误由后面的分类器学习.这旨在通过赋予错误标记的示例更高的权重(例如AdaBoost)来利用模型之间的相关性。
并行训练器,其中基础模型是并行生成的.这通过平均错误来利用模型之间的独立性(例如随机森林)
这里主要介绍其中的Boosting,Boosting算法试图从几个较弱模型的错误中建立一个强大的学习者(预测模型)。首先从训练数据创建模型.然后通过尝试减少上一个模型中的错误,从上一个创建第二个模型.依次添加模型,每个模型都对其前身进行校正,直到训练数据得到完美预测或添加了最大数量的模型。
Boosting包括AdaBoost,Gradient Tree Boosting等等.
AdaBoost
AdaBoost是一种非常流行的Boosting技术,旨在将多个弱分类器组合起来构建一个强分类器.弱分类器比随机猜测性能更好,但在为对象指定类方面仍然表现不佳。单个分类器可能无法准确预测对象的类别,但当我们将多个弱分类器分组,每个弱分类器从其他错误分类的对象中逐步学习时,我们可以建立一个这样的强模型。这里提到的分类器可以是任何基本分类器,从决策树(通常是默认的)到逻辑回归等。
步骤1:基于加权样本在训练数据之上进行弱分类器(例如decision stump).每个样本的权重表明正确分类的重要性。最初,对于第一个stump,我们给予所有样本相等的权重。
第2步:我们为每个变量创建一个决策树桩,看看每个树桩将样本分类到目标类的效果如何.
步骤3:将更多的权重分配给分类错误的样本,以便在下一个决策阶段对其进行正确分类.权重也根据分类器的精度分配给每个分类器,这意味着高精度=高权重
第4步:从第2步开始重复,直到所有数据点都被正确分类,或者达到最大迭代级别.
首先给每个样本相同权重,计算得到的预测结果错误率,根据错误率得到α
然后对权重进行更新
当预测输出和实际输出一致时(样本分类正确),Alpha为正。在这种情况下,我们减少了样权重,因为已经表现得很好了。
当预测输出与实际类别不一致时(即样本分类错误),Alpha为负值。在这种情况下需要增加样本权重,以便在下一个树桩中不会重复相同的错误分类。1
2
3
4
5
6
7
8
9
10
11
12
13
14
15
16
17
18
19
20
21
22
23
24
25
26
27
28
29
30
31
32
33
34
35
36
37
38
39
40
41
42
43
44
45
46
47
48
49
50
51
52
53
54
55
56
57
58
59
60
61
62
63
64
65
66
67
68
69
70
71
72
73
74
75
76
77
78
79
80
81
82
83
84
85
86
87
88
89
90
91
92
93
94
95
96
97
98
99
100
101
102
103
104
105
106
107
108
109
110
111
112
113
114
115
116
117
118
119
120
121
122
123
124
125
126'''
Created on Nov 28, 2010
Adaboost is short for Adaptive Boosting
@author: Peter
'''
from numpy import *
def loadSimpData():
datMat = matrix([[ 1. , 2.1],
[ 2. , 1.1],
[ 1.3, 1. ],
[ 1. , 1. ],
[ 2. , 1. ]])
classLabels = [1.0, 1.0, -1.0, -1.0, 1.0]
return datMat,classLabels
def loadDataSet(fileName): #general function to parse tab -delimited floats
numFeat = len(open(fileName).readline().split('\t')) #get number of fields
dataMat = []; labelMat = []
fr = open(fileName)
for line in fr.readlines():
lineArr =[]
curLine = line.strip().split('\t')
for i in range(numFeat-1):
lineArr.append(float(curLine[i]))
dataMat.append(lineArr)
labelMat.append(float(curLine[-1]))
return dataMat,labelMat
def stumpClassify(dataMatrix,dimen,threshVal,threshIneq):#just classify the data
retArray = ones((shape(dataMatrix)[0],1))
if threshIneq == 'lt':
retArray[dataMatrix[:,dimen] <= threshVal] = -1.0
else:
retArray[dataMatrix[:,dimen] > threshVal] = -1.0
return retArray
def buildStump(dataArr,classLabels,D):
dataMatrix = mat(dataArr); labelMat = mat(classLabels).T
m,n = shape(dataMatrix)
numSteps = 10.0; bestStump = {}; bestClasEst = mat(zeros((m,1)))
minError = inf #init error sum, to +infinity
for i in range(n):#loop over all dimensions
rangeMin = dataMatrix[:,i].min(); rangeMax = dataMatrix[:,i].max();
stepSize = (rangeMax-rangeMin)/numSteps
for j in range(-1,int(numSteps)+1):#loop over all range in current dimension
for inequal in ['lt', 'gt']: #go over less than and greater than
threshVal = (rangeMin + float(j) * stepSize)
predictedVals = stumpClassify(dataMatrix,i,threshVal,inequal)#call stump classify with i, j, lessThan
errArr = mat(ones((m,1)))
errArr[predictedVals == labelMat] = 0
weightedError = D.T*errArr #calc total error multiplied by D
#print "split: dim %d, thresh %.2f, thresh ineqal: %s, the weighted error is %.3f" % (i, threshVal, inequal, weightedError)
if weightedError < minError:
minError = weightedError
bestClasEst = predictedVals.copy()
bestStump['dim'] = i
bestStump['thresh'] = threshVal
bestStump['ineq'] = inequal
return bestStump,minError,bestClasEst
def adaBoostTrainDS(dataArr,classLabels,numIt=40):
weakClassArr = []
m = shape(dataArr)[0]
D = mat(ones((m,1))/m) #init D to all equal
aggClassEst = mat(zeros((m,1)))
for i in range(numIt):
bestStump,error,classEst = buildStump(dataArr,classLabels,D)#build Stump
#print "D:",D.T
alpha = float(0.5*log((1.0-error)/max(error,1e-16)))#calc alpha, throw in max(error,eps) to account for error=0
bestStump['alpha'] = alpha
weakClassArr.append(bestStump) #store Stump Params in Array
#print "classEst: ",classEst.T
expon = multiply(-1*alpha*mat(classLabels).T,classEst) #exponent for D calc, getting messy
D = multiply(D,exp(expon)) #Calc New D for next iteration
D = D/D.sum()
#calc training error of all classifiers, if this is 0 quit for loop early (use break)
aggClassEst += alpha*classEst
#print "aggClassEst: ",aggClassEst.T
aggErrors = multiply(sign(aggClassEst) != mat(classLabels).T,ones((m,1)))
errorRate = aggErrors.sum()/m
print "total error: ",errorRate
if errorRate == 0.0: break
return weakClassArr
def adaClassify(datToClass,classifierArr):
dataMatrix = mat(datToClass)#do stuff similar to last aggClassEst in adaBoostTrainDS
m = shape(dataMatrix)[0]
aggClassEst = mat(zeros((m,1)))
for i in range(len(classifierArr)):
classEst = stumpClassify(dataMatrix, classifierArr[i]['dim'],\
classifierArr[i]['thresh'],\
classifierArr[i]['ineq'])#call stump classify
aggClassEst += classifierArr[i]['alpha']*classEst
print aggClassEst
return sign(aggClassEst)
def plotROC(predStrengths, classLabels):
import matplotlib.pyplot as plt
cur = (1.0,1.0) #cursor
ySum = 0.0 #variable to calculate AUC
numPosClas = sum(array(classLabels)==1.0)
yStep = 1/float(numPosClas); xStep = 1/float(len(classLabels)-numPosClas)
sortedIndicies = predStrengths.argsort()#get sorted index, it's reverse
fig = plt.figure()
fig.clf()
ax = plt.subplot(111)
#loop through all the values, drawing a line segment at each point
for index in sortedIndicies.tolist()[0]:
if classLabels[index] == 1.0:
delX = 0; delY = yStep;
else:
delX = xStep; delY = 0;
ySum += cur[1]
#draw line from cur to (cur[0]-delX,cur[1]-delY)
ax.plot([cur[0],cur[0]-delX],[cur[1],cur[1]-delY], c='b')
cur = (cur[0]-delX,cur[1]-delY)
ax.plot([0,1],[0,1],'b--')
plt.xlabel('False positive rate'); plt.ylabel('True positive rate')
plt.title('ROC curve for AdaBoost horse colic detection system')
ax.axis([0,1,0,1])
plt.show()
print "the Area Under the Curve is: ",ySum*xStep